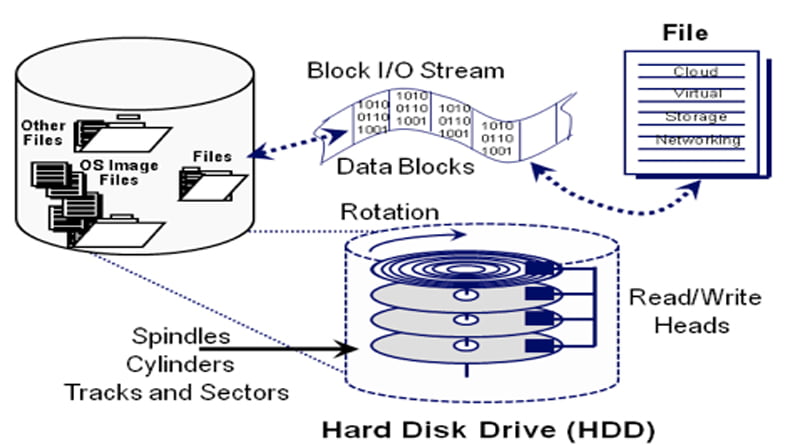
Storage I/O Performansı
Merhaba Teknolojik Blog Okurları, bu yazımda sizlere kullanmış olduğumuz storage ünitelerinin I/O performanslarını basit bir şekilde nasıl test edebileceğinizi anlatmaya çalışacağım.
I/O ( in/out ) yani 1 saniyede diskin yapabildiği işlem olarak ta düşünebilirsiniz.
Ben testleri 7200 RPM lik klasik SATA PC disk’i ile SAS RAID 5 bir disk yapısı ve RAID 5 Yapılmış bir NAS cihazı ile yapacağım. Farklara bakarak disk okuma yazma performansları hakkında bilgi edinebilirsiniz.
Performans testi için Microsoft için derlenmiş bir araç kullnacağım Arac DiskSpd linki tıklayarak aracı indirebilirsiniz. Bu bilgiler ışığında oluşturacağınız storage’ın hangi IO değerlerinde olabileceğini aşağı yukarı anlayabilirsiniz. Çok yüksek I/O değerleri için 100 lerce diskin bir araya getirilmesi gerekmektedir.
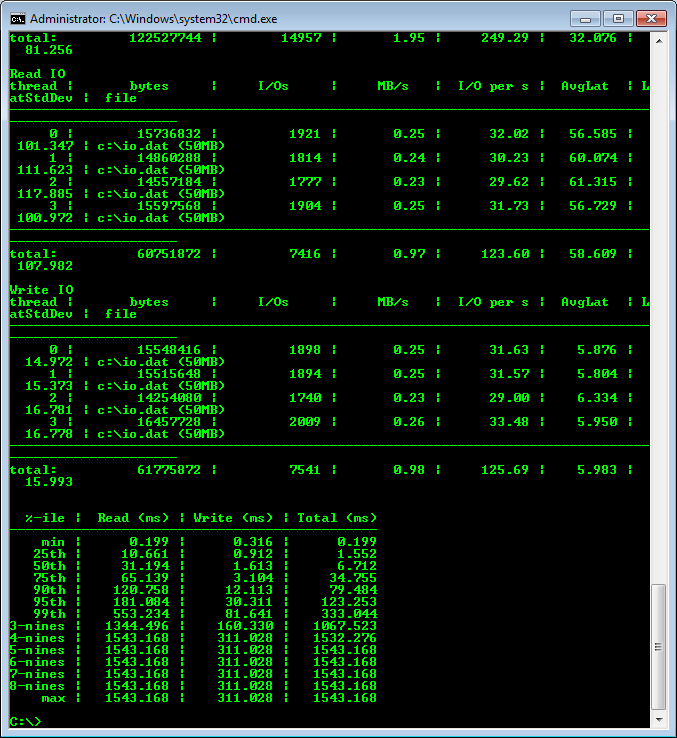
Komutlar MS Tech sayfasında kullanılan komutlarla aynıdır.
c:>diskspd.exe -b8K -d60 -h -L -o2 -t4 -r -w50 -c50M c:\io.dat
Bu komut 7200 RPM SATA disk içindir.
Command Line: diskspd.exe -b8K -d60 -h -L -o2 -t4 -r -w50 -c50M c:\io.dat
Input parameters:
timespan: 1
————-
duration: 60s
warm up time: 5s
cool down time: 0s
measuring latency
random seed: 0
path: ‘c:\io.dat’
think time: 0ms
burst size: 0
software and hardware write cache disabled
performing mix test (write/read ratio: 50/100)
block size: 8192
using random I/O (alignment: 8192)
number of outstanding I/O operations: 2
thread stride size: 0
threads per file: 4
using I/O Completion Ports
IO priority: normal
Results for timespan 1:
*******************************************************************************
actual test time: 60.00s
thread count: 4
proc count: 4
CPU | Usage | User | Kernel | Idle
——————————————-
0| 20.51%| 11.93%| 8.58%| 79.48%
1| 17.34%| 11.49%| 5.85%| 82.66%
2| 46.88%| 30.47%| 16.41%| 53.12%
3| 2.96%| 1.82%| 1.14%| 97.03%
——————————————-
avg.| 21.93%| 13.93%| 8.00%| 78.07%
Total IO
thread | bytes | I/Os | MB/s | I/O per s | AvgLat | LatStdDev | file
—————————————————————————————————–
0 | 29704192 | 3626 | 0.47 | 60.43 | 33.009 | 70.586 | c:\io.dat (50MB)
1 | 31408128 | 3834 | 0.50 | 63.90 | 31.249 | 66.037 | c:\io.dat (50MB)
2 | 29179904 | 3562 | 0.46 | 59.37 | 33.645 | 69.307 | c:\io.dat (50MB)
3 | 31014912 | 3786 | 0.49 | 63.10 | 31.670 | 71.749 | c:\io.dat (50MB)
—————————————————————————————————–
total: 121307136 | 14808 | 1.93 | 246.80 | 32.364 | 69.439
Read IO
thread | bytes | I/Os | MB/s | I/O per s | AvgLat | LatStdDev | file
—————————————————————————————————–
0 | 14958592 | 1826 | 0.24 | 30.43 | 57.300 | 91.307 | c:\io.dat (50MB)
1 | 15343616 | 1873 | 0.24 | 31.22 | 55.485 | 86.207 | c:\io.dat (50MB)
2 | 14761984 | 1802 | 0.23 | 30.03 | 57.796 | 89.082 | c:\io.dat (50MB)
3 | 15114240 | 1845 | 0.24 | 30.75 | 56.696 | 94.838 | c:\io.dat (50MB)
—————————————————————————————————–
total: 60178432 | 7346 | 0.96 | 122.44 | 56.807 | 90.407
Write IO
thread | bytes | I/Os | MB/s | I/O per s | AvgLat | LatStdDev | file
—————————————————————————————————–
0 | 14745600 | 1800 | 0.23 | 30.00 | 8.367 | 19.330 | c:\io.dat (50MB)
1 | 16064512 | 1961 | 0.26 | 32.68 | 8.100 | 18.191 | c:\io.dat (50MB)
2 | 14417920 | 1760 | 0.23 | 29.33 | 8.918 | 19.698 | c:\io.dat (50MB)
3 | 15900672 | 1941 | 0.25 | 32.35 | 7.881 | 18.188 | c:\io.dat (50MB)
—————————————————————————————————–
total: 61128704 | 7462 | 0.97 | 124.37 | 8.300 | 18.836
%-ile | Read (ms) | Write (ms) | Total (ms)
———————————————-
min | 0.199 | 0.287 | 0.199
25th | 10.893 | 0.789 | 1.535
50th | 34.233 | 1.596 | 8.072
75th | 69.846 | 3.603 | 41.512
90th | 116.362 | 29.906 | 82.482
95th | 170.276 | 47.495 | 118.130
99th | 429.384 | 89.545 | 292.449
3-nines | 1095.663 | 161.672 | 830.726
4-nines | 1539.569 | 320.368 | 1529.687
5-nines | 1539.569 | 320.368 | 1539.569
6-nines | 1539.569 | 320.368 | 1539.569
7-nines | 1539.569 | 320.368 | 1539.569
8-nines | 1539.569 | 320.368 | 1539.569
max | 1539.569 | 320.368 | 1539.569
=============================================
RAID 5 Performansı ( 4 X 10K SAS Disk )
Command Line: Diskspd.exe -b8K -d60 -h -L -o2 -t4 -r -w50 -c50M E:\io.dat
Input parameters:
timespan: 1
————-
duration: 60s
warm up time: 5s
cool down time: 0s
measuring latency
random seed: 0
path: ‘E:\io.dat’
think time: 0ms
burst size: 0
software and hardware write cache disabled
performing mix test (write/read ratio: 50/100)
block size: 8192
using random I/O (alignment: 8192)
number of outstanding I/O operations: 2
thread stride size: 0
threads per file: 4
using I/O Completion Ports
IO priority: normal
Results for timespan 1:
*******************************************************************************
actual test time: 60.00s
thread count: 4
proc count: 24
CPU | Usage | User | Kernel | Idle
——————————————-
0| 32.71%| 3.83%| 28.88%| 67.29%
1| 32.32%| 4.27%| 28.05%| 67.68%
2| 38.18%| 5.42%| 32.76%| 61.82%
3| 67.89%| 4.77%| 63.12%| 32.11%
4| 3.88%| 1.38%| 2.50%| 96.12%
5| 0.52%| 0.08%| 0.44%| 99.48%
6| 4.92%| 1.43%| 3.49%| 95.08%
7| 0.13%| 0.03%| 0.10%| 99.87%
8| 0.57%| 0.39%| 0.18%| 99.43%
9| 0.00%| 0.00%| 0.00%| 100.00%
10| 0.05%| 0.05%| 0.00%| 99.95%
11| 0.03%| 0.00%| 0.03%| 99.97%
12| 4.66%| 1.09%| 3.57%| 95.34%
13| 2.32%| 0.76%| 1.56%| 97.68%
14| 2.81%| 1.15%| 1.67%| 97.19%
15| 0.57%| 0.21%| 0.36%| 99.43%
16| 0.03%| 0.00%| 0.03%| 99.97%
17| 0.00%| 0.00%| 0.00%| 100.00%
18| 0.00%| 0.00%| 0.00%| 100.00%
19| 0.10%| 0.10%| 0.00%| 99.90%
20| 0.00%| 0.00%| 0.00%| 100.00%
21| 0.00%| 0.00%| 0.00%| 100.00%
22| 0.00%| 0.00%| 0.00%| 100.00%
23| 0.00%| 0.00%| 0.00%| 100.00%
——————————————-
avg.| 7.99%| 1.04%| 6.95%| 92.01%
Total IO
thread | bytes | I/Os | MB/s | I/O per s | AvgLat | LatStdDev | file
—————————————————————————————————–
0 | 6127140864 | 747942 | 97.39 | 12465.69 | 0.159 | 0.101 | E:\io.dat (50MB)
1 | 6095618048 | 744094 | 96.89 | 12401.55 | 0.160 | 0.098 | E:\io.dat (50MB)
2 | 6115770368 | 746554 | 97.21 | 12442.55 | 0.159 | 0.106 | E:\io.dat (50MB)
3 | 5994291200 | 731725 | 95.28 | 12195.40 | 0.161 | 0.084 | E:\io.dat (50MB)
—————————————————————————————————–
total: 24332820480 | 2970315 | 386.76 | 49505.19 | 0.160 | 0.098
Read IO
thread | bytes | I/Os | MB/s | I/O per s | AvgLat | LatStdDev | file
—————————————————————————————————–
0 | 3061981184 | 373777 | 48.67 | 6229.61 | 0.158 | 0.084 | E:\io.dat (50MB)
1 | 3046809600 | 371925 | 48.43 | 6198.74 | 0.158 | 0.082 | E:\io.dat (50MB)
2 | 3059253248 | 373444 | 48.63 | 6224.06 | 0.158 | 0.095 | E:\io.dat (50MB)
3 | 2992267264 | 365267 | 47.56 | 6087.78 | 0.160 | 0.073 | E:\io.dat (50MB)
—————————————————————————————————–
total: 12160311296 | 1484413 | 193.28 | 24740.19 | 0.159 | 0.084
Write IO
thread | bytes | I/Os | MB/s | I/O per s | AvgLat | LatStdDev | file
—————————————————————————————————–
0 | 3065159680 | 374165 | 48.72 | 6236.08 | 0.160 | 0.115 | E:\io.dat (50MB)
1 | 3048808448 | 372169 | 48.46 | 6202.81 | 0.161 | 0.113 | E:\io.dat (50MB)
2 | 3056517120 | 373110 | 48.58 | 6218.49 | 0.160 | 0.117 | E:\io.dat (50MB)
3 | 3002023936 | 366458 | 47.72 | 6107.63 | 0.162 | 0.094 | E:\io.dat (50MB)
—————————————————————————————————–
total: 12172509184 | 1485902 | 193.48 | 24765.00 | 0.161 | 0.110
%-ile | Read (ms) | Write (ms) | Total (ms)
———————————————-
min | 0.060 | 0.063 | 0.060
25th | 0.141 | 0.143 | 0.142
50th | 0.149 | 0.150 | 0.149
75th | 0.161 | 0.163 | 0.162
90th | 0.196 | 0.198 | 0.197
95th | 0.224 | 0.226 | 0.224
99th | 0.304 | 0.307 | 0.306
3-nines | 0.845 | 0.947 | 0.892
4-nines | 2.953 | 3.653 | 3.215
5-nines | 9.369 | 10.877 | 10.105
6-nines | 21.350 | 37.252 | 35.710
7-nines | 21.560 | 38.153 | 38.153
8-nines | 21.560 | 38.153 | 38.153
max | 21.560 | 38.153 | 38.153
==============================================
NAS RAID 5 ( 3X 7200 RPM 3 TB )
Command Line: diskspd.exe -b8K -d60 -h -L -o2 -t4 -r -w50 -c50M \\10.137.67.67\Public\io.dat
Input parameters:
timespan: 1
————-
duration: 60s
warm up time: 5s
cool down time: 0s
measuring latency
random seed: 0
path: ‘\\10.137.67.67\Public\io.dat’
think time: 0ms
burst size: 0
software and hardware write cache disabled
performing mix test (write/read ratio: 50/100)
block size: 8192
using random I/O (alignment: 8192)
number of outstanding I/O operations: 2
thread stride size: 0
threads per file: 4
using I/O Completion Ports
IO priority: normal
Results for timespan 1:
*******************************************************************************
actual test time: 60.00s
thread count: 4
proc count: 4
CPU | Usage | User | Kernel | Idle
——————————————-
0| 61.39%| 8.03%| 53.35%| 38.61%
1| 26.31%| 8.76%| 17.55%| 73.69%
2| 40.80%| 15.03%| 25.77%| 59.20%
3| 11.78%| 1.04%| 10.74%| 88.22%
——————————————-
avg.| 35.07%| 8.22%| 26.85%| 64.93%
Total IO
thread | bytes | I/Os | MB/s | I/O per s | AvgLat | LatStdDev | file
—————————————————————————————————–
0 | 446865408 | 54549 | 7.10 | 909.17 | 2.198 | 10.793 | \\10.137.67.67\Public\io.dat (50MB)
1 | 439836672 | 53691 | 6.99 | 894.87 | 2.233 | 10.869 | \\10.137.67.67\Public\io.dat (50MB)
2 | 413818880 | 50515 | 6.58 | 841.93 | 2.374 | 11.886 | \\10.137.67.67\Public\io.dat (50MB)
3 | 445480960 | 54380 | 7.08 | 906.35 | 2.205 | 10.814 | \\10.137.67.67\Public\io.dat (50MB)
—————————————————————————————————–
total: 1746001920 | 213135 | 27.75 | 3552.32 | 2.250 | 11.086
Read IO
thread | bytes | I/Os | MB/s | I/O per s | AvgLat | LatStdDev | file
—————————————————————————————————–
0 | 224247808 | 27374 | 3.56 | 456.24 | 2.915 | 14.554 | \\10.137.67.67\Public\io.dat (50MB)
1 | 220323840 | 26895 | 3.50 | 448.26 | 2.835 | 10.454 | \\10.137.67.67\Public\io.dat (50MB)
2 | 208240640 | 25420 | 3.31 | 423.68 | 3.051 | 13.446 | \\10.137.67.67\Public\io.dat (50MB)
3 | 222019584 | 27102 | 3.53 | 451.71 | 2.912 | 14.273 | \\10.137.67.67\Public\io.dat (50MB)
—————————————————————————————————–
total: 874831872 | 106791 | 13.91 | 1779.89 | 2.927 | 13.288
Write IO
thread | bytes | I/Os | MB/s | I/O per s | AvgLat | LatStdDev | file
—————————————————————————————————–
0 | 222617600 | 27175 | 3.54 | 452.93 | 1.475 | 4.408 | \\10.137.67.67\Public\io.dat (50MB)
1 | 219512832 | 26796 | 3.49 | 446.61 | 1.628 | 11.237 | \\10.137.67.67\Public\io.dat (50MB)
2 | 205578240 | 25095 | 3.27 | 418.26 | 1.688 | 10.015 | \\10.137.67.67\Public\io.dat (50MB)
3 | 223461376 | 27278 | 3.55 | 454.64 | 1.502 | 5.455 | \\10.137.67.67\Public\io.dat (50MB)
—————————————————————————————————–
total: 871170048 | 106344 | 13.85 | 1772.44 | 1.571 | 8.251
%-ile | Read (ms) | Write (ms) | Total (ms)
———————————————-
min | 0.628 | 0.494 | 0.494
25th | 1.550 | 0.801 | 1.085
50th | 2.181 | 1.126 | 1.576
75th | 3.087 | 1.612 | 2.481
90th | 4.261 | 2.430 | 3.587
95th | 5.235 | 3.130 | 4.479
99th | 11.259 | 5.296 | 8.217
3-nines | 60.470 | 30.571 | 41.713
4-nines | 687.475 | 254.350 | 375.280
5-nines | 1400.532 | 1398.339 | 1400.532
6-nines | 1401.416 | 1401.197 | 1401.416
7-nines | 1401.416 | 1401.197 | 1401.416
8-nines | 1401.416 | 1401.197 | 1401.416
max | 1401.416 | 1401.197 | 1401.416
Teşekkürler,
Aziz Ozdemiroglu
Teknolojik-Blog.Com